Annotating Grafana panels with data from Sonarr using Elasticsearch
I have been meaning to learn how to use Elasticsearch for quite some time. I had used it in the past in an ELK stack, but never really understood it all too well. Also, it had been a few years since doing so, so my mind was a little rusty. The way i learn something is to set a little project with that software or tool and see if i can get it working. Which is what i did. At the end, you will end up with Grafana graphs similar to follow.
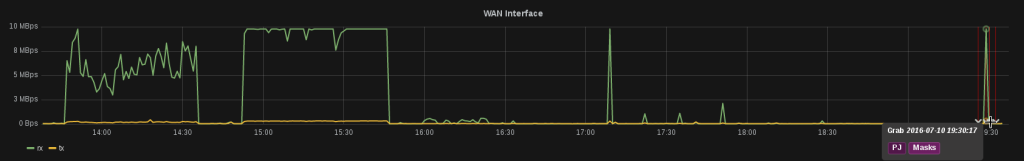
You can see the Annotation added to the WAN Interface graph of my firewall. By hovering over the little arrow at the bottom of the graph it displays a tooltip with the details from Sonarr. You can see it shows it was a “Grab” event (Sonarr grabbed the NZB) along with the name of the show being grabbed (PJ Masks, i have no idea, something my son enjoys). You will also get another annotation when the download itself starts.
One thing i will mention is that at the moment, the annotations will show on every panel in the Dashboard you set it on. There is currently a feature request on GitHub for this to be changed.
As im just learning to use Elasticsearch in any anger, i have made use of as many visual aids as i could. So here is a list of plugins i have installed with Elasticsearch to make it simpler to see whas going on:
Im going to assume you already have Elasticsearch installed. If not, it is pretty simple to setup. I am running it on CentOS 7. You can find the installation instructions Here.
The instructions for installing Kibana are Here.
The instructions for installing Sense are Here.
The instructions for installing Logstash are Here
Logstash Configs
Here are my configs that im using. Again, im only learning Elasticsearch so somethings may not be “best practice” or there may be a better way of doing certain things. If so, let me know.
Firstly, in logstash im using the HTTP input handler.
Here is my logstash input-http.conf
input {
  http {
    port => 8081
  }
}
This is on my internal network so im not too concerned about passwording.
Dont forget to allow that port through the firewall.
Here is my ouput.conf, sending the data to Elasticsearch.
output {
  elasticsearch { hosts => ["IP.ADDR.E.SS:9200"]
  index => "sonarr"}
}
As you can see, i have created a new Index in Elasticsearch to store the Sonarr data.
I havent created a filter as i wasnt actually sure waht data was sent by sonarr. Perhaps ill look into that little more in future. But for now im just happy it works.
Sonarr Config
Here is a screenshot of my sonarr config. The menu is in “Settings” > “Connect” then select “New” and choose “Webhook”.
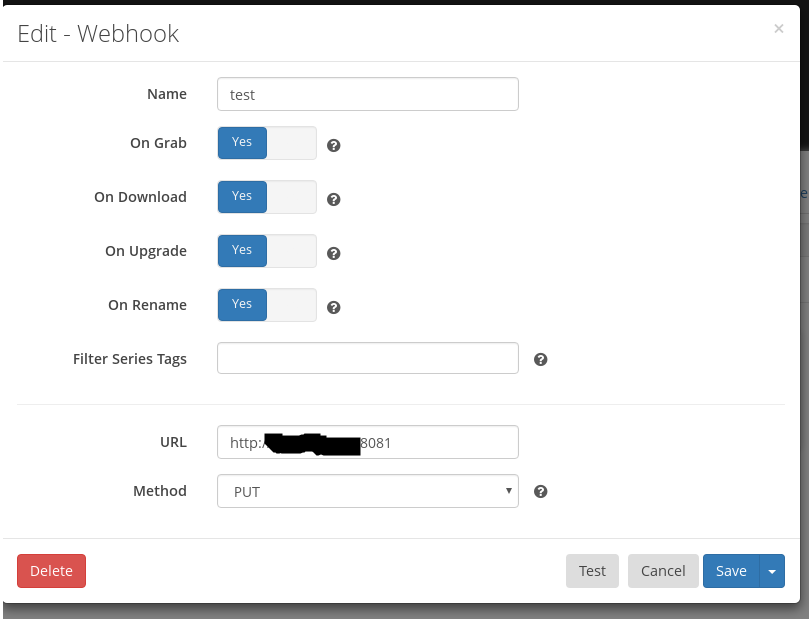
Its pretty self explanatory. Just set the IP and port to that of the Logstash host.
Grafana Settings
The final part is actually telling Grafana what it needs to do.
Firstly you need to add Elasticsearch as a Datasource. Here is my config:
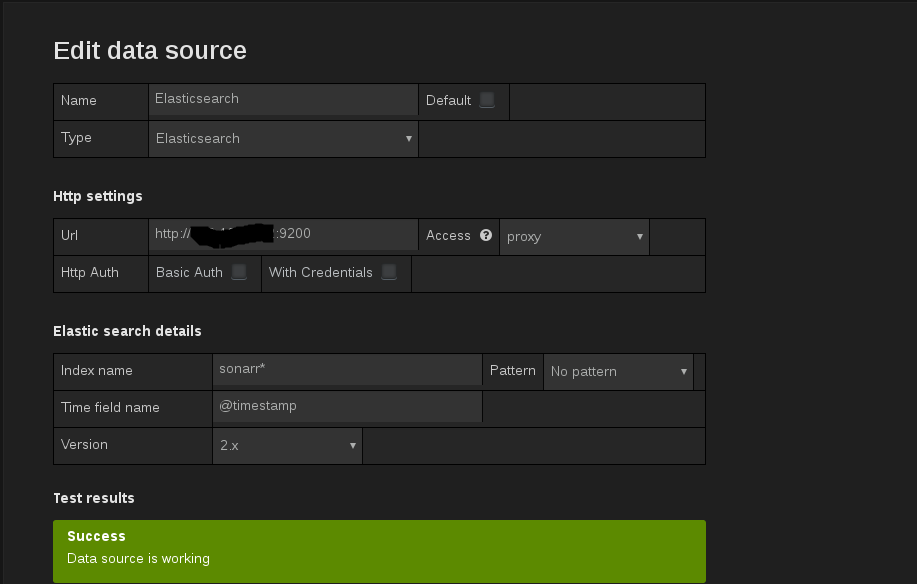
You can see i have set the Elasticsearch host IP and port, along with the Index i am using.
Finall you need to add the details to the annotation setting. In the Dashboard that you are setting this up on, click “Settings” and select “Annotations”
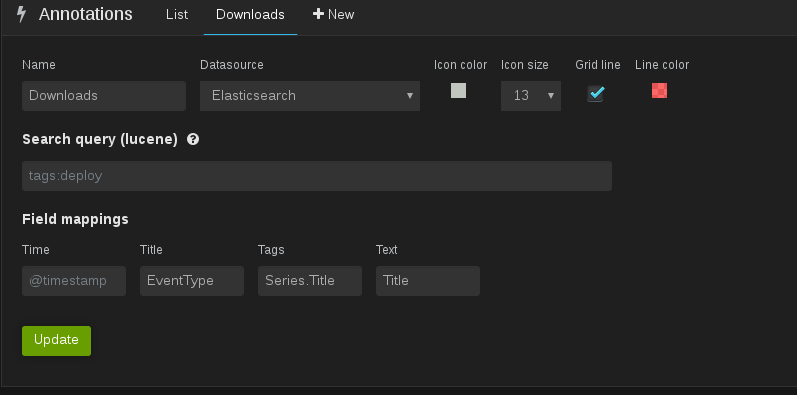
Thats it. You can try and press the “Test” button in Sonarr to see if you get a test Annotation appear. You should do.