Graphing Pi-Hole stats with Graphite and Grafana
Everyone loves the Pi-Hole. It does a great job blockig ad’s across your entire network. The admin page is also really useful to see whats been going on. Unfortunately the admin interface only gives details of the last 24 hours. I love graphs and graphing things. So i wanted more data.
I already had Graphite and Grafana setup for my previous projects. I just needed a way to get the data into them.
Luckily, the Pi-hole guys provide a nice little API wich provides these details. The following is a small python script is knocked up which pulls and parses that API then forwards the data into my Graphite server.
#! /usr/bin/python

import requests
import socket
import time
import platform

HOSTNAME = "pi-hole"
CARBON_SERVER = "192.168.0.175"
CARBON_PORT = 2003
DELAY = 10 # seconds

def send_msg(message):
#    print ('sending message:\n%s' % message)
    sock = socket.socket()
    sock.connect((CARBON_SERVER, CARBON_PORT))
    sock.sendall(message)
    sock.close()

if __name__ == '__main__':
        while True:
          api = requests.get('http://192.168.0.131/admin/api.php')
          API_out = api.json()
# I could just iterate through the response. But by explicitly defining each one i wont have an issue should the order change.
          domains_blocked = (API_out['domains_being_blocked']).replace(',', '')
          dns_queries_today = (API_out['dns_queries_today']).replace(',', '')
          ads_percentage_today = (API_out['ads_percentage_today'])
          ads_blocked_today = (API_out['ads_blocked_today']).replace(',', '')

          timestamp = int(time.time())

          lines = [
                'pihole.%s.domains_blocked %s %d' % (HOSTNAME, domains_blocked, timestamp),
                'pihole.%s.dns_queries_today %s %d' % (HOSTNAME, dns_queries_today, timestamp),
                'pihole.%s.ads_percentage_today %s %d' % (HOSTNAME, ads_percentage_today, timestamp),
                'pihole.%s.ads_blocked_today %s %d' % (HOSTNAME, ads_blocked_today, timestamp)
          ]
          message = '\n'.join(lines) + '\n'
          send_msg(message)
          time.sleep(DELAY)
My python is probably not the greatest. But it does work. Here are my current graphs.
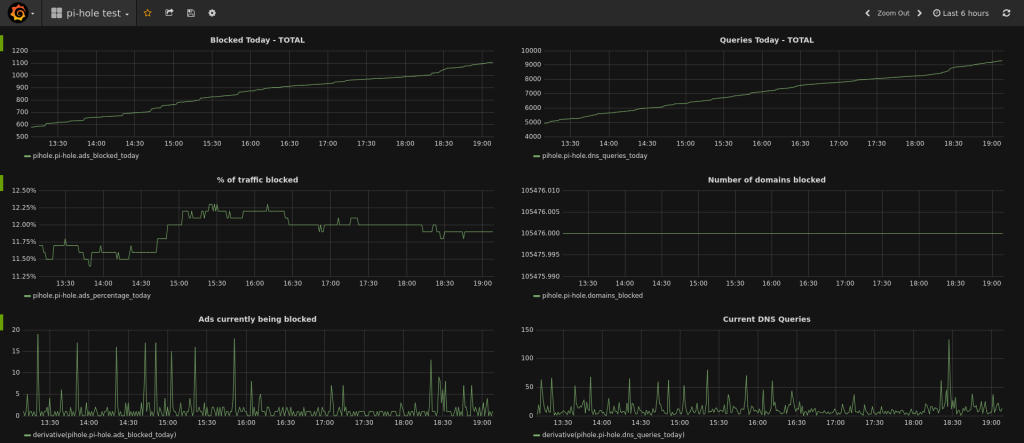
6 Hour
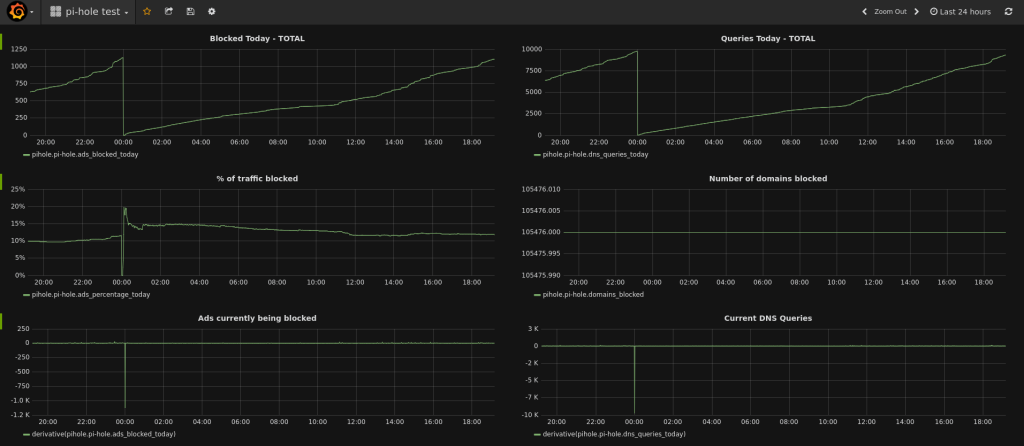
24 Hour
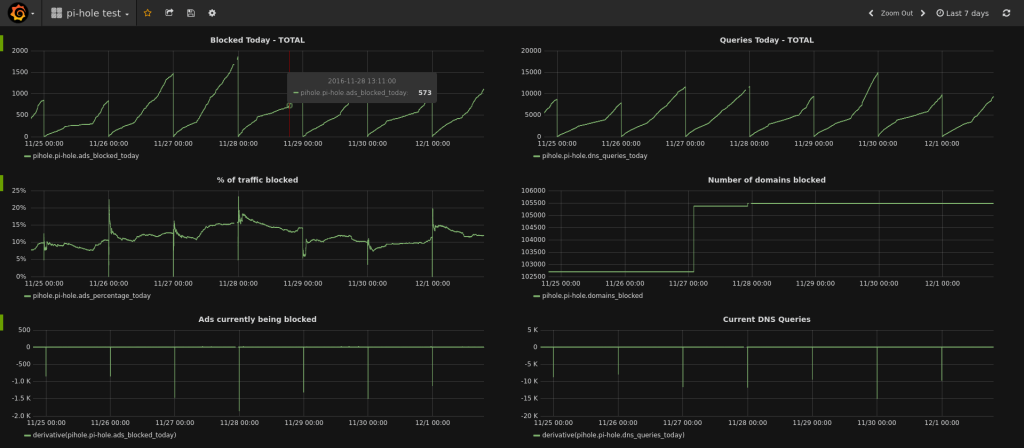
7 days
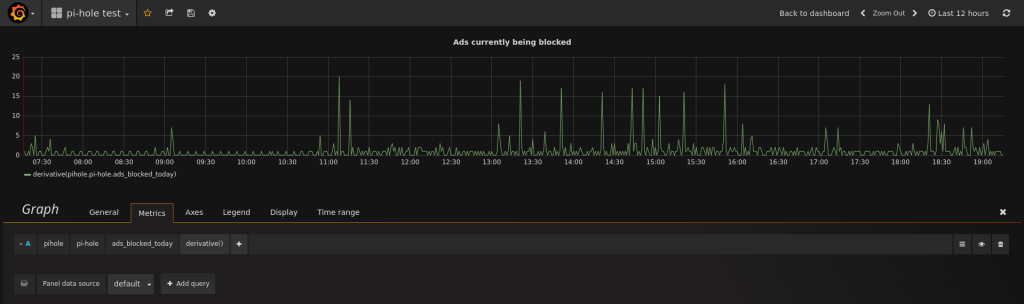
Finally, to get the “Currently blocked” i use the “Derivative” modifier in Grafana, like this: